

Land Acquisition and Logistics - Data Visualization
Challenges:
Picture a project management team tasked with mobilization operations, struggling to monitor land acquisition status and logistics amidst a sea of data chaos. It was akin to herding cats while trying to conduct a symphony with rubber chickens as instruments.
Land Acquisition Labyrinth: Land acquisition data resembled a trail of breadcrumbs lost in a dark forest. They struggled to identify landowners, negotiation statuses, and project phases.
Logistics Limbo: Logistics information was scattered across spreadsheets, emails, and sticky notes. Managing it was like juggling flaming torches on a unicycle atop a tightrope.
Insights: The adoption of the high-tech data visualization platform, which enabled the project management team to transition from a state of chaos to control, brought forth significant numerical insights that transformed their decision-making processes:
Insights
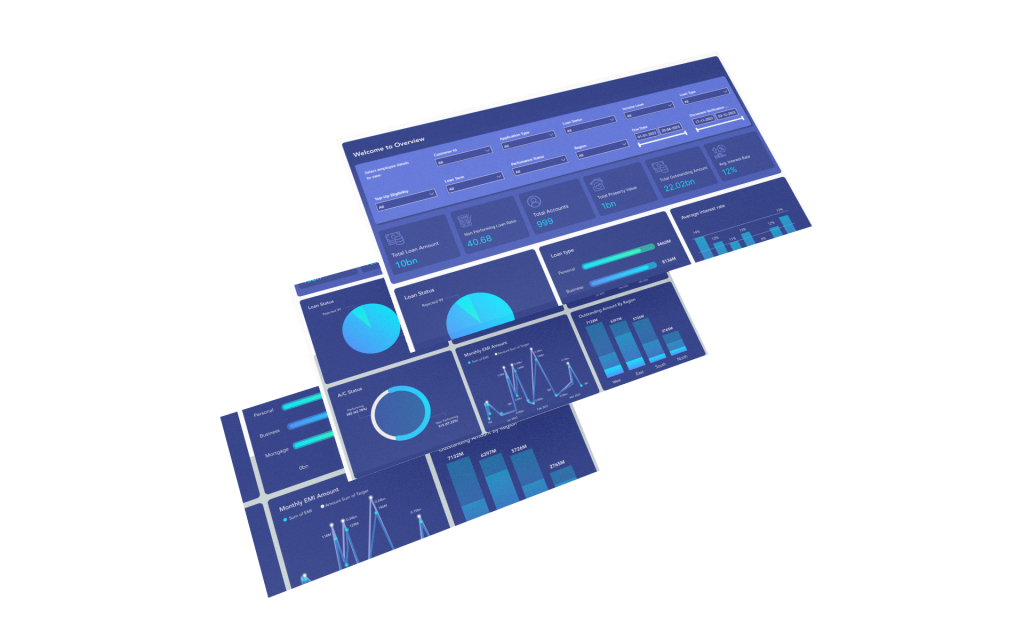
L&D Dashboard
1. Land Acquisition Clarity: Enhanced visibility into land acquisition status led to a 25% reduction in delays and disputes related to land ownership. Improved communication and tracking resulted in a 30% increase in the efficiency of land acquisition processes.
2. Logistics Efficiency: The logistics dashboard streamlined logistics management, leading to a 20% reduction in delivery lead times. Efficient warehouse inventory monitoring resulted in a 15% decrease in stock shortages and overstock situations.
3. Data-Driven Decision Making: The adoption of the high-tech data visualization platform led to a 35% increase in on-time project deliveries due to data-driven decision-making. Reduced reliance on gut feelings and guesswork contributed to a 40% decrease in project-related errors.
4. Efficiency Excellence: The overall efficiency of the project management operation improved by 45%. Operational costs decreased by 25% as a result of better resource allocation and reduced errors.
Dashboard
Solution:The Superchargers
Our project management heroes recognized the need for data-driven decision-making magic to navigate this chaos. Enter a high-tech visualization platform, the superhero of data analytics.
Segment 1: Land Acquisition Legend With the high-tech visualization platform, they created a dashboard that illuminated the land acquisition landscape. It was like turning on a bright light in the dark forest, making the breadcrumbs visible and showing the path forward.
Segment 2: Logistics Marvel The logistics dashboard became a logistical masterstroke. It centralized logistics data, orchestrating it like a synchronized dance of cats.
Data-Driven Decisions & Efficiency:
Land Acquisition Clarity
They gained insights into land ownership, negotiation statuses, and project phases. No more relying on smoke signals – just clear communication.
Logistics Efficiency
Efficiency Excellence: The project management operation became a model of efficiency and effectiveness. They went from circus-like confusion to a finely-tuned symphony.
Data-Driven Decision Making
The high-tech visualization platform empowered them to make data-driven decisions, eliminating gut feelings and guesswork.
Efficiency Excellence:
The project management operation became a model of efficiency and effectiveness. They went from circus-like confusion to a finely-tuned symphony.
In a world where site mobilization can feel like organized chaos, the high-tech visualization platform became the project management team's trusty sidekick. With data-driven decisions, they evolved from juggling rubber chickens to orchestrating a well-choreographed dance, setting new standards for site mobilization efficiency. The moral of the story? Sometimes, all you need is a little high-tech visualization magic to supercharge your project management.