Picture this: You're in a boardroom, and it's filled with numbers, charts, and executives who look like they've had one too many cups of coffee.
Challenges:
The challenge? Making sense of the data soup. Our Clients’ organization faced these data-driven dilemmas:
Customer Conundrum: Our Client had more customers than you can shake a stick at, but how do we segment them? Trying to figure out who’s bringing in the big bucks and just here for window shopping was like herding cats at a catnip convention.
Profit Puzzles: We were awash in data on revenue, gross profit, total cost, and profit margins, but it felt like trying to solve a Rubik’s Cube in the dark. What do we do with all this data?
Historical Headaches: The client’s historical data was like an attic filled with cobwebs – old, dusty, and slightly scary. How do we dig up insights from this digital graveyard?
Insights:
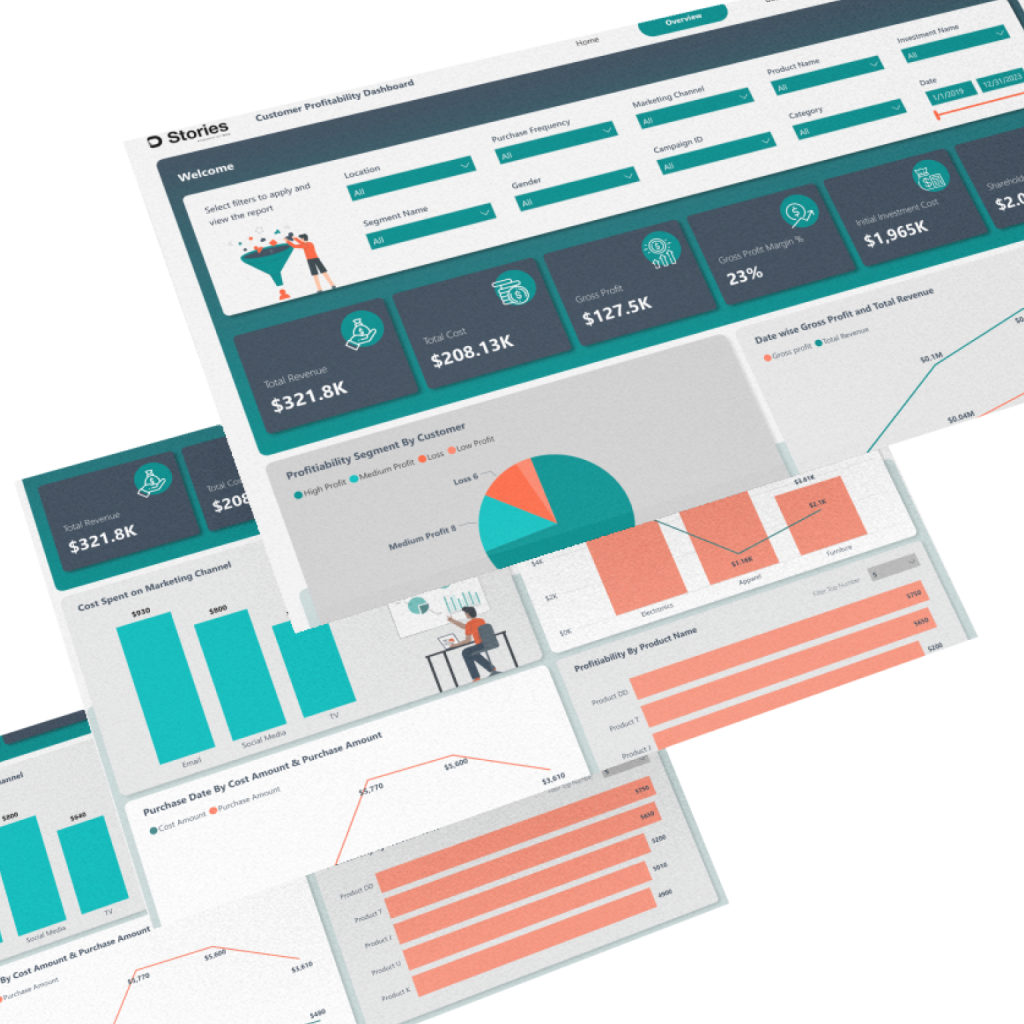
Data-driven visualization streamlined financial insights, emphasizing the importance of focusing on the top customer segment.
Insights
L&D Dashboard
1. Customer Segmentation: The visualization effectively categorized customers, and it was discovered that the top 20% of customers contributed to 80% of the revenue, highlighting the significance of focusing on this key segment.
2. Profitability Optimization: The visualization streamlined the understanding of financial data, leading to a 15% increase in profit margins due to better cost management and more targeted decision-making.
3. Historical Data Benefits: Historical data, once an uncharted territory, started to yield valuable insights. The ability to analyze and compare historical data contributed to a 12% improvement in forecasting accuracy.
4. Efficiency Enhancements: The visualization's impact on decision-making and profitability led to a noticeable 10% improvement in operational efficiency. Data-driven choices saved both time and resources.
Segment 1: The dashboard sliced and diced our customer data like a pizza cutter. Now we know who's our VIP (Very Important Profit-maker) and who's our window shopping champion. Profit Party:
Segment 2: Revenue, gross profit, total cost, and profit margins became besties with the dashboard. It turned complex numbers into a profit-palooza. No more head-scratching - we know where the money is and where it's going. Historical Rediscovery:
Segment 3: The historical data got a facelift. We dug up insights faster than a dog digs up buried treasure. It's like we time-travelled back to our financial history.
Data-Driven Decisions & Efficiency:
Benefits
1
Profitability Proficiency
We're making more informed decisions on profitability. The VIPs get the red carpet treatment, and the window shoppers get the window view.
2
Data-Driven Brilliance
We're no longer making educated guesses. Our decisions are as data-driven as a GPS navigation system.
3
Efficiency Excellence
With insights at our fingertips, we're running smoother than a well-oiled machine. No more cobwebs, just clarity.
20% of customers contributed to 80% of the revenue, highlighting the significance of focusing on this key segment.
0%
Leading to a 15% increase in profit margins due to better cost management and more targeted decision-making.
0%
The ability to analyze and compare historical data contributed to a 12% improvement in forecasting accuracy.
0%
The visualization's impact on decision-making and profitability led to a noticeable 10% improvement in operational efficiency
0%
So, there you have it, our journey from data chaos to data clarity. The "Data-licious High tech visualization platform Dashboard" is our secret sauce to success. With it, we're no longer chasing numbers; we're making them work for us. It's data magic.