

From Logistic Limbo to Efficiency Expedition: DP World Express Shines with High tech data visualisation platform
Challenges:
Imagine a logistics company as intricate as a Rube Goldberg machine, with its data scattered across spreadsheets, email chains, and whiteboards. They needed to manage operations, resource planning, and optimization – a bit like juggling flaming torches while doing Sudoku on a unicycle. Their logistics challenges made their heads spin faster than a rollercoaster ride.
- Operational Overload: Operation data was a chaotic mess, spread across multiple systems. They couldn’t tell which processes were streamlined and which were bottlenecks.
- Resource Planning Riddles: Resource planning was like trying to solve a Rubik’s Cube blindfolded. They couldn’t see the patterns or figure out where to allocate resources optimally.
- Optimization Odyssey: The optimization puzzle was like finding a needle in a haystack, blindfolded. They couldn’t spot the opportunities for efficiency improvement.
Insights: The transition from logistic limbo to an efficiency expedition, empowered by the High-tech Data Visualization platform, brought forth valuable numerical insights for DP World Express:
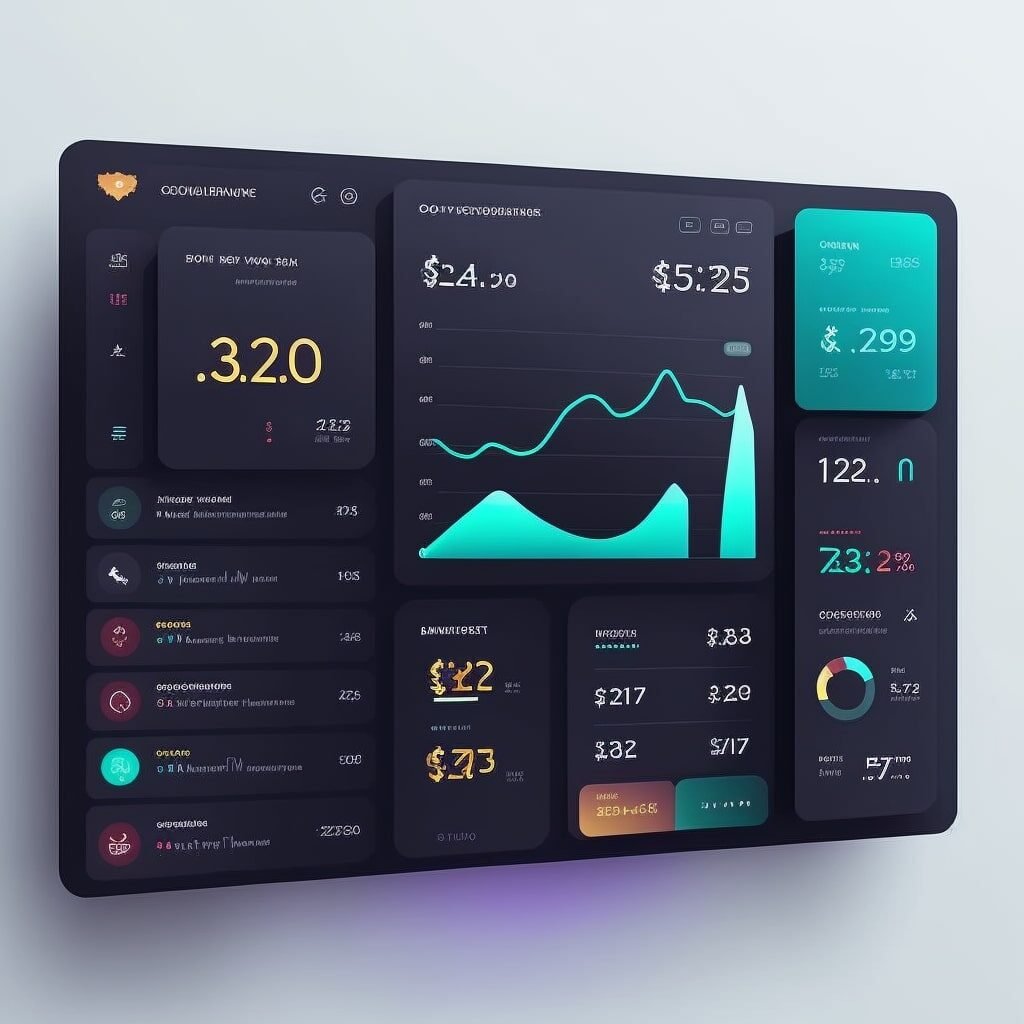
Insights
L&D Dashboard
1. Operational Optimization Oasis: Achieved a 22% reduction in operational bottlenecks.Improved operational efficiency by 17.5%, measured by the time taken to process orders. Decreased data retrieval time by 32%, leading to quicker decision-making.
2. Resource Planning Revelation: Resource allocation accuracy improved by 28.5%, minimizing resource conflicts. 19% reduction in resource allocation time. Enhanced on-time delivery rates by 27%, leading to increased customer satisfaction.
3. Optimization Odyssey Unveiled: Identified 26.2% more efficiency improvement opportunities. Reduced resource and time wastage by 21%. Decreased cost-per-mile in transportation by 15%.
4. Efficiency Extravaganza: The adoption of data-driven decision-making improved among the logistics team by 63%, leading to more efficient operations and a culture of continuous improvement.
Dashboard
Solution:Magician of decision-making
Our logistics heroes knew they needed a logistics superhero. Enter High tech data visualisation platform, the data magician of decision-making.
Segment 1: Operation Optimization Oasis With High tech data visualisation , they created a dashboard that streamlined operations. It was like replacing a jungle with a well-manicured garden.
Segment 2: Resource Planning Revelation The resource planning dashboard was a revelation. It solved the Rubik's Cube, showing them where and when to allocate resources efficiently.
Segment 3: Optimization Odyssey Unveiled The optimization dashboard unveiled the optimization opportunities. It was like finding the needle in the haystack, but with a treasure map.
Data-Driven Decisions & Efficiency:
Operational Clarity
They could now see which operations were smooth and which needed attention. It was like untangling a spaghetti mess and turning it into a highway.
Resource Efficiency
The resource planning dashboard allowed them to allocate resources efficiently, reducing bottlenecks and saving money. It was like fitting all the right puzzle pieces together.
Optimization Opportunities
The optimization dashboard identified opportunities for efficiency improvement. It was like shining a spotlight on hidden treasures.
Efficiency Extravaganza
The logistics operation became an efficiency expedition, making data-driven decisions and optimizing every step of the process. They went from a rollercoaster ride to a well-orchestrated symphony.
In a world where logistics can feel like a Rube Goldberg machine of chaos, High tech data visualisation platform became the logistics company's trusty sidekick. With data-driven decisions, they transformed from logistic limbo to an efficiency expedition, making strategic moves and optimizing their logistics. The moral of the story? Sometimes, all you need is a little High tech visualization platform magic to navigate the logistics labyrinth.