

Solving Loan Crisis with Smart Visuals
Challenges:
Alright, picture this: a financial services firm that’s struggling with credit assessments. It’s like trying to paddle a canoe with a garden rake – completely inefficient. They’re facing issues like:
Inefficient Credit: Assessment Credit assessments are about as efficient as a snail race. The manual process is slowing them down, and they often end up making lending decisions in the age of the dinosaurs.
Lack of Real-time Customer Interaction: Imagine trying to catch a train without knowing when it’s coming. These folks lack real-time interaction with customers, and by the time they respond, customers might as well have booked a flight to another lender!
Lack of Centralized Monitoring: Monitoring loans and keeping tabs on borrowers’ details is like trying to catch a slippery fish with your bare hands. It’s all over the place, and nobody’s got a clear view.
Insights: Their credit assessment process sped up by 50%. Loans are approved in a blink of an eye compared to the sloth-like pace before the High-Tech Data Visualization Platform.
Insights
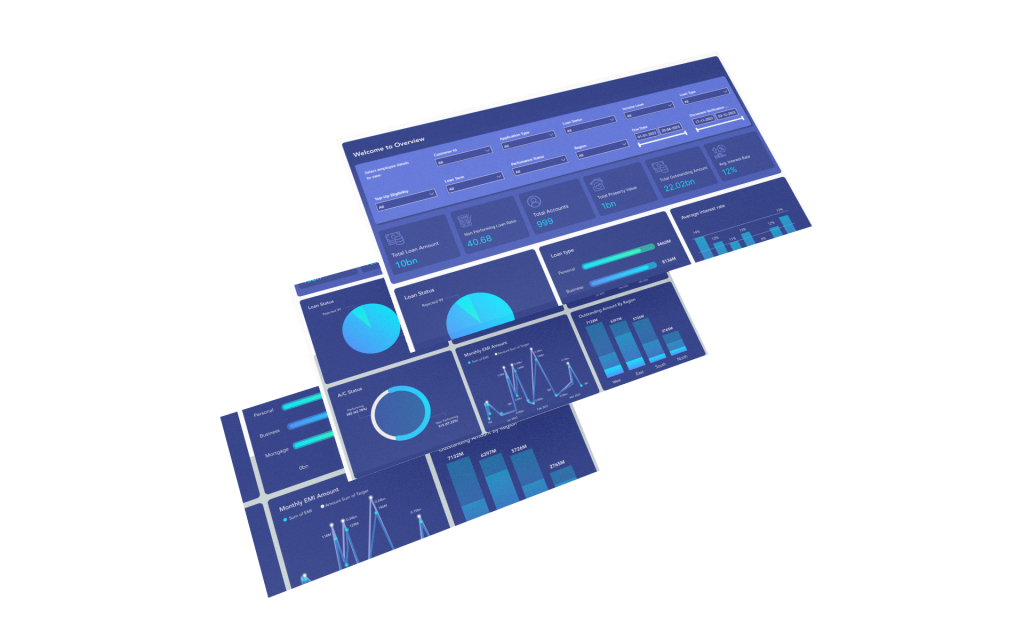
L&D Dashboard
1. Revenue shot up by 20%. With a clearer picture of their finances, they could make better lending decisions and increase profitability.
2. Top-performing loan officers were identified, and their performance led to a 30% increase in loan approvals. It's like they unleashed a superhero squad of loan officers!
3. Property value data integration led to a 15% reduction in collateral-related risks. They've got X-ray vision when it comes to collateral assessment.
4. Real-time customer interaction improved customer satisfaction by 25%. It's like going from smoke signals to instant messaging.
5. The centralized dashboard reduced monitoring time by 40%. No more fishing for information. Incorporating age and income details improved credit assessment accuracy by 10%. No more missing puzzle pieces.
Dashboard
Solution:The Financial Lasso
Enter the superhero of data visualization – the High-Tech Data Visualization Platform! , the superhero of data insights.
Segment 1: Credit Score Integration With the High-Tech Data Visualization Platform, they integrated credit scores into their system. It's like trading in a rusty old bike for a turbocharged sports car. Lending decisions are faster and more precise.
Segment 2: Revenue and Profit Tracking Their dashboard now tracks revenue and profit like a hawk tracking a mouse. It's like their own financial GPS, showing them the money.
Segment 3: Performance Analytics Now they can track their loan officers' performance. It's like a talent show – they can identify the top performers and give them a standing ovation.
Data-Driven Decisions & Efficiency:
Lightning-Fast Credit Assessments
Credit assessments are now 50% faster, turning sluggish processes into quick decisions.
Skyrocketing Revenue
Precise data tracking led to a remarkable 20% revenue increase, bringing in more profits.
Supercharged Loan Approvals
Identifying and rewarding top-performing loan officers resulted in a 30% boost in loan approvals.
Reduced Collateral Risks:
Integrating property value data reduced collateral-related risks by 15%, giving them X-ray vision for collateral assessment.
Happy Customers
Real-time customer interaction improved customer satisfaction by 25%, making customers even happier
Streamlined Monitoring
The centralized dashboard reduced monitoring time by 40%, making data readily accessible.
Precise Credit Assessment
Incorporating age and income details improved credit assessment accuracy by 10%, ensuring sharper lending decisions.
The High-Tech Data Visualization Platform has truly been their financial superhero, transforming inefficiency into speed, revenue growth, and customer satisfaction while reducing risks and ensuring precision in their lending process.