

From Learning Loops to Data Excellence: How our High-Tech Data Visualization Transformed Telecom Profitability"
Challenges:
In the whirlwind world of telecommunications, our client faced a barrage of challenges akin to a chaotic comedy show. Fluctuating revenues, vanishing profits, escalating operational costs, and a flood of service tickets left them befuddled.
- Revenue Rollercoaster: The monthly revenue chart resembled a thrilling rollercoaster ride at an amusement park. It was fun, but the ups and downs gave us motion sickness.
- Gross Profit Puzzles: Gross profit margins were as mysterious as a magician’s disappearing act. Client never knew when they’d vanish and reappear.
- Operational Expenses Extravaganza: The operational expenses were multiplying faster than rabbits during mating season, leaving our client’s budget in shambles.
- Staff Productivity Mysteries: Staff’s productivity levels were a riddle even Sherlock Holmes couldn’t crack. Our Client suspected the office plants were working overtime.
- Shrink Ratio Mystery: Like chasing unicorns, it baffled our Client. Was stock disappearing or was the storage room a portal to another dimension?
Solution : Our High Tech Visualization Platform transformed chaos into clarity. It streamlined revenue, revealed profit margins, organized expenses, and simplified complex metrics, ensuring precise decision-making for sustained profitability.
Solution
Profitable Precision
1. Revenue Rescue: The High Tech Visualization Platform turned our revenue chart into a neatly scripted comedy routine. We knew exactly when the punchlines (profits) were coming.
2. Gross Profit Giggles: No more disappearing acts! With the High Tech Visualization Platform, gross profit margins were so visible you could practically see them waving at you.
3. Operational Expense Organization: The High Tech Visualization Platform transformed our expense chaos into a well-structured comedy lineup. Everything had its place, and we weren't overspending on the joke budget.
4. Productivity Punchlines: Staff productivity was no longer a mystery. We had clear insights into who the office MVPs were, and we even gave a standing ovation to the plants (they deserved it). sense chaos into a well-structured comedy lineup. Everything had its place, and we weren't overspending on the joke budget.
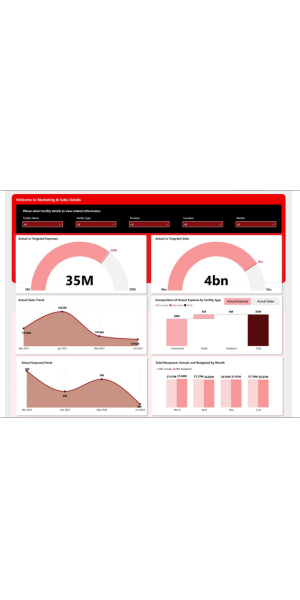
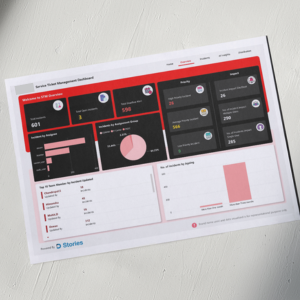
Data Visualisation
Outlook: Efficiency, Insights, Profits
With our innovative solution, our client's revenue chart transformed into a carefully scripted comedy routine, revealing profits like well-timed punchlines.
Gross profit margins, once elusive, became visible, practically waving at them. Operational expenses, once in disarray, found structure and discipline, eliminating overspending hilarities. Service tickets transitioned from circus chaos to organized comedy, with open tickets gracefully exiting the stage.
Staff productivity, once a mystery, was unveiled, even acknowledging the unsung heroes like office plants.
The enigmatic shrink ratio was demystified into simple math, and key performance metrics turned into a favorite comedy club, where they not only understood the jokes but added a few of their own.
Data-Driven Decisions & Efficiency:
Smooth Operations
Operational expenses were under control, making budget a well-scripted show without surprises.
Efficiency Enlightenment
Service tickets and staff productivity improved significantly. The office plants even took a vacation; they deserved it after all their hard work.
Shrink Ratio Simplified
No longer searches for hidden dimensions in the storage room. Inventory managers become the masters of efficient stock management.
Data-Driven Comedy
Decisions were now backed by data, making Data owners the kings and queens of data-driven comedy. Our Client now could predict the next laugh, We mean, profit.
In the chaos of Telecom Business, the High Tech Visualization Platform emerged as the saviour. With data-driven insights and a dash of humour, we turned business chaos into a well-scripted comedy. Challenges became punchlines, and chaos transformed into efficiency. The tale of transformation showcased the power of visualisation with the right data sets.